
⚡ Key Takeaways
You don't need a $50K APM license to understand what your Java app is doing in production. Micrometer handles metrics, OpenTelemetry's Java agent replaces proprietary tracing, and Flight Recorder gives you zero-overhead profiling. Here's how they fit together into a stack that actually works in 2026.
Let me paint a picture. It's 2:17 AM. Your checkout service is throwing 503s. You don't know if it's a slow database query, a memory leak, or some third-party API that's suddenly choking. Your old APM tool shows a flatline. Or worse, it shows data, but you can't correlate traces across services because each one used a different vendor's SDK.
This is the observability paradox. You spent millions on tools. You still can't answer one question: what is actually happening right now?
The good news? The JVM observability landscape has fundamentally shifted in 2025-2026. The old model of buying Datadog, New Relic, or Dynatrace licenses and installing their heavy agents is being replaced by a lighter, open, more portable stack. And it's actually better.
The Old Way (And Why It's Breaking)
For over a decade, the playbook was simple. Buy an APM tool. Install their Java agent with a JVM flag. Hope it covers your stack. Pay per host or per service. Repeat.
But here's what nobody tells you: those proprietary agents were never designed for the modern cloud-native Java world. They were built when your app ran on two EC2 instances with MySQL in the back. Now you're running 200 microservices across Kubernetes, with event-driven architectures, sidecars, and service meshes. The old agents add latency, they miss context, and they lock you into a vendor.
Plus, the cost curve is brutal. At scale, per-host pricing turns into per-database-exfiltration pricing. And when you try to build a unified view across services, you end up with five different dashboards and zero correlation.
So what changed? Three things converged: the OpenTelemetry project matured, Java's built-in profiling tools became production-ready, and Micrometer adopted OTel as its export backend.
Micrometer: The Metrics Layer That Actually Works
If you've used Spring Boot, you've probably seen Micrometer before. It's the metrics instrumentation framework that Spring Boot uses under the hood. But here's what most developers miss: Micrometer isn't just a Spring thing anymore.
Micrometer is a vendor-agnostic metrics facade. Think of it like SLF4J, but for metrics. You write instrumentation once using Micrometer's API, and you can export those metrics to Prometheus, Datadog, CloudWatch, or almost anything else. The real game-changer in 2026 is that Micrometer now supports OpenTelemetry as a first-class export target.
Here's what a typical Micrometer setup looks like in a Spring Boot 3.3+ app:
Here's what a typical Micrometer setup looks like in a Spring Boot 3.3+ app. Think of this as your observability foundation:

dependencies {

    implementation 'io.micrometer:micrometer-observation'

    implementation 'io.micrometer:micrometer-tracing-bridge-otel'

    implementation 'io.opentelemetry:opentelemetry-exporter-otlp'

}
# application.yml

management:

  observations:

    key-values:

      application: my-service

      environment: production
Notice something important? You're not importing any vendor-specific SDK. You're writing standard Java code that instruments your service. And because Micrometer wraps the OpenTelemetry API, your metrics are portable.
The key insight here is observation. Micrometer 1.13+ introduced a new Observation API that unifies metrics, tracing, and logging under one mental model. Instead of manually creating timers and then separately creating spans, you wrap your business logic in an observation, and Micrometer handles both metrics and traces automatically.
Here's the pattern that saves you hours:
Observation.createNotStarted("http.requests", observationRegistry)

    .lowCardinalityKeyValue("http.method", "GET")

    .lowCardinalityKeyValue("http.path", "/api/checkout")

    .observeTiming(() -> {

        // your actual business logic here

        return checkoutService.process(order);

    });
One observation. Two signals. Zero vendor lock-in.
OpenTelemetry Java Agent: The Tracing Revolution
This is where things get really interesting. OpenTelemetry's Java agent is a single JAR file that you attach to your JVM with a command-line flag. It automatically instruments your entire stack without touching a single line of application code.
That means HTTP clients, HTTP servers, databases, message queues, Redis, gRPC, and dozens of other libraries are instrumented by default. You get distributed traces out of the box. No SDK integration. No manual span creation. No vendor-specific configuration.
Here's the command that changes everything:
java -javaagent:opentelemetry-javaagent.jar \

  -Dotel.service.name=checkout-service \

  -Dotel.traces.exporter=otlp \

  -Dotel.exporter.otlp.endpoint=http://collector:4318 \

  -jar myapp.jar

That's it. Your entire application is now tracing-aware. Every HTTP request, every database query, every Kafka message is automatically captured as a span with proper context propagation.
But here's the thing most people get wrong. The OpenTelemetry agent complements Micrometer, it doesn't replace it. Think of it this way: Micrometer handles your business-level metrics and custom observations. The OTel agent handles infrastructure-level tracing. Together, they give you complete visibility without duplication.
The secret sauce in 2026 is that Micrometer and OpenTelemetry now share the same context. When you create a Micrometer observation, the OTel agent automatically picks up the trace context. When the agent creates a span, Micrometer can attach metrics to it. They're not competing. They're cooperating.
One practical tip: enable automatic span correlation. Add this to your agent configuration:
-Dotel.java.enabled=true

-Dotel.javaagent.experimental.exporter.otlp.timeout=30s

-Dotel.metrics.exporter=none  # Let Micrometer handle metrics
By setting the metrics exporter to none, you're telling the OTel agent to only handle tracing. Micrometer becomes your single source of truth for metrics. The agent handles the rest.
Flight Recorder: Zero-Overhead Profiling That Actually Works
Java Flight Recorder (JFR) has been around since Java 7, but for years it was considered a development tool. You'd attach it to a process, record for 15 seconds, and analyze offline. It was great for performance testing, but nobody trusted it in production.
That changed in 2024-2025. With Java 21's structured concurrency and Java 22's continuous recording features, JFR became production-ready. And in 2026, it's the single most powerful observability tool in the JVM arsenal.
Here's why JFR is different from everything else. Traditional profilers sample your application. They pause threads, measure execution time, and reconstruct call stacks. This adds overhead. It can change behavior. And it can miss rare events.
JFR works differently. It's event-based. The JVM records structured events directly from the runtime, with zero sampling and zero pause. The overhead is typically less than 1%. And because it's recording actual events, not samples, you never miss what happened.
Here's how you enable continuous JFR recording in production:
java -XX:StartFlightRecording=filename=/var/log/jfr/app.jfr, \

  duration=0, \

  settings=profile, \

  disk=true, \

  maxage=24h, \

  maxsize=512m \

  -jar myapp.jar
Let me break that down. duration=0 means continuous recording. disk=true writes to disk instead of memory. maxage=24h keeps only the last 24 hours. maxsize=512m caps the file size. The JVM manages the ring buffer automatically, overwriting old data when it's full.
The real magic happens when you combine JFR with your other observability tools. When a production incident occurs, you can correlate the exact JFR events with your OpenTelemetry traces and Micrometer metrics. You're not guessing. You're looking at the actual thread states, GC pauses, lock contention, and allocation rates at the exact moment the problem occurred.
One pattern I've seen work incredibly well: use JFR for incident response and OTel for day-to-day monitoring. JFR records are too large to stream continuously to a backend. But when something goes wrong, you can export the last N minutes of JFR data and analyze it with JFR CLI or VisualVM.
How It All Fits Together
Here's the stack I recommend for 2026. It's open-source, vendor-neutral, and scales from a single service to a thousand:
- Micrometer for application-level metrics and observations
- OpenTelemetry Java Agent for infrastructure tracing
- Java Flight Recorder for zero-overhead production profiling
- OpenTelemetry Collector as the ingestion pipeline
- Prometheus + Grafana for metrics storage and visualization
- Jaeger or Tempo for trace storage and exploration
The architecture looks like this. Your application emits metrics via Micrometer to the OTel Collector. Your application emits traces via the OTel agent to the same Collector. JFR writes events to disk, which you can export on demand. The Collector routes everything to the appropriate backend.
One thing I want to emphasize: you don't need to set this up all at once. Start with the OTel agent. That's the lowest-hanging fruit. You'll get distributed tracing in 10 minutes with a single JVM flag. Then add Micrometer for custom business metrics. Finally, enable JFR for production profiling.
Also, don't overlook the power of JFR event filtering. In production, you probably don't need every single event. Use -XX:FlightRecorderOptions=stackdepth=128,settings=profile to control the verbosity. The profile settings give you a balanced set of events that covers 95% of debugging scenarios without overwhelming storage.
Common Pitfalls (And How to Avoid Them)
Here are the mistakes I see most often when teams adopt this stack:
- Instrumenting everything. You don't need a metric for every method call. Focus on business-critical paths: API endpoints, database queries, external service calls, and key business operations.
- Ignoring cardinality. High-cardinality tags will destroy your metrics backend. Keep tag values low-cardinality. Use attributes for high-cardinality data instead.
- Not testing the pipeline. Set up a health check endpoint that verifies your metrics and traces are actually being exported. Nothing is worse than thinking you have observability and discovering you don't during an incident.
- Forgetting about JFR in containers. JFR works great in containers, but you need to mount a volume for the .jfr files. Without it, the recording goes to /tmp and disappears when the container restarts.
- Mixing OTel and vendor SDKs. Don't use the Datadog SDK alongside the OTel agent. You'll get duplicate spans and confused trace context. Pick one pipeline and stick with it.
Real-World Example: The Checkout Service
Let me walk through a concrete example. Imagine you're running a checkout service. Here's how you'd set it up:
# Docker Compose snippet

services:

  checkout:

    image: myapp:latest

    command: >

      java -javaagent:/otlp/opentelemetry-javaagent.jar

      -Dotel.service.name=checkout-service

      -Dotel.traces.exporter=otlp

      -Dotel.metrics.exporter=otlp

      -Dotel.exporter.otlp.endpoint=http://collector:4318

      -XX:StartFlightRecording=filename=/data/jfr/app.jfr,

      duration=0,settings=profile,disk=true

      -jar /app/checkout.jar

    volumes:

      - jfr-data:/data/jfr
  collector:

    image: otel/opentelemetry-collector-contrib:latest

    command: ["--config=/etc/otelcol/config.yaml"]
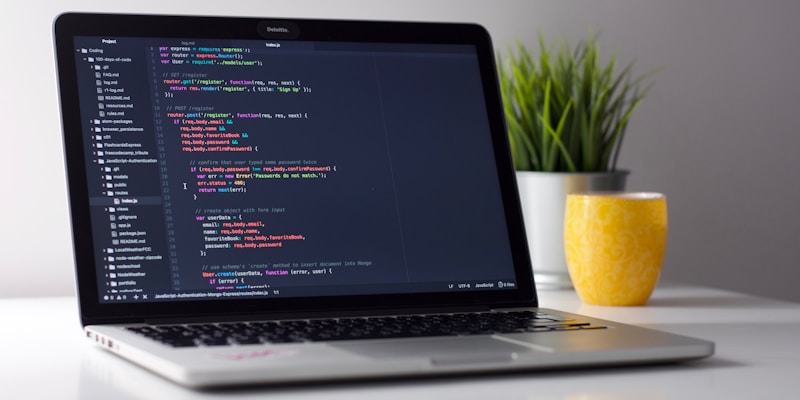
In your application code, you'd add Micrometer observations for the critical paths. This is where the rubber meets the road:
@ObservationAnnotation

@PostMapping("/checkout")

public ResponseEntity checkout(@RequestBody OrderRequest request) {

    return Observation.createNotStarted("checkout.processing", observationRegistry)

        .lowCardinalityKeyValue("order.type", request.getType())

        .observe(() -> {

            Order order = processOrder(request);

            metrics.counter("checkout.completed").increment();

            return ResponseEntity.ok(order);

        });

}
Within hours, you'll have distributed traces showing the full checkout flow, metrics on processing times and error rates, and JFR recordings capturing thread states and GC events. When something breaks, you'll know exactly where, when, and why.
FAQ
Do I still need an APM tool if I'm using OpenTelemetry?
Not necessarily. The OTel Collector can export to Prometheus, Jaeger, Tempo, or any backend you choose. However, if you want a managed experience with alerting, anomaly detection, and incident management, tools like Datadog and New Relic now accept OTel data. You get the best of both worlds: open instrumentation with optional managed backend.
Can I use JFR and the OTel agent together?
Absolutely. They're completely independent. JFR records JVM-level events at the runtime level. The OTel agent instruments your application code and libraries. Together, they give you visibility from the application layer down to the JVM layer.
What's the performance impact of this stack?
With proper configuration, the overhead is minimal. Micrometer metrics add roughly 0.1-0.5% CPU. The OTel agent adds 1-3% depending on trace sampling. JFR in profile mode adds less than 1%. Combined, you're looking at 2-5% overhead, which is typically negligible compared to the value of actually knowing what's happening in production.
Is this stack production-ready for high-throughput services?
Yes. Companies like Shopify, Starbucks, and ING are running this exact stack in production with millions of requests per second. The key is proper configuration: use asynchronous exporters, batch spans, and tune your sampling rates. Don't just run with defaults.
What about Java 21 virtual threads?
Virtual threads work seamlessly with all three tools. Micrometer's observations work with virtual threads because they're based on scoped values. The OTel agent automatically captures virtual thread context. JFR records virtual thread lifecycle events. If you're using virtual threads, you might actually see improved observability because the granularity of events increases.
Bottom Line
The JVM observability landscape in 2026 is fundamentally different from what it was five years ago. You no longer need to choose between open-source flexibility and vendor-managed convenience. Micrometer, OpenTelemetry, and Flight Recorder work together to give you complete visibility without the lock-in.
Start small. Add the OTel agent first. Then layer in Micrometer for your business metrics. Enable JFR when you need deep profiling. Before long, you'll have a stack that's more powerful, more portable, and significantly cheaper than what you were using before.
The question isn't whether you can afford to adopt this stack. It's whether you can afford to keep flying blind. If you're managing Java workloads at scale, you might also want to read about fixing native image performance or exploring Java's Foreign Function API for native interop.